Summative Assessment – World Happiness
Quiz Summary
0 of 14 Questions completed
Questions:
Information
You have already completed the quiz before. Hence you can not start it again.
Quiz is loading…
You must sign in or sign up to start the quiz.
You must first complete the following:
Results
Results
0 of 14 Questions answered correctly
Your time:
Time has elapsed
You have reached 0 of 0 point(s), (0)
Earned Point(s): 0 of 0, (0)
0 Essay(s) Pending (Possible Point(s): 0)
Categories
- Not categorized 0%
- 1
- 2
- 3
- 4
- 5
- 6
- 7
- 8
- 9
- 10
- 11
- 12
- 13
- 14
- Current
- Review
- Answered
- Correct
- Incorrect
-
Question 1 of 14
1. Question
Recreate the below visualisation:
Note: The visualisations within this assessment are using the Theme: City Park.
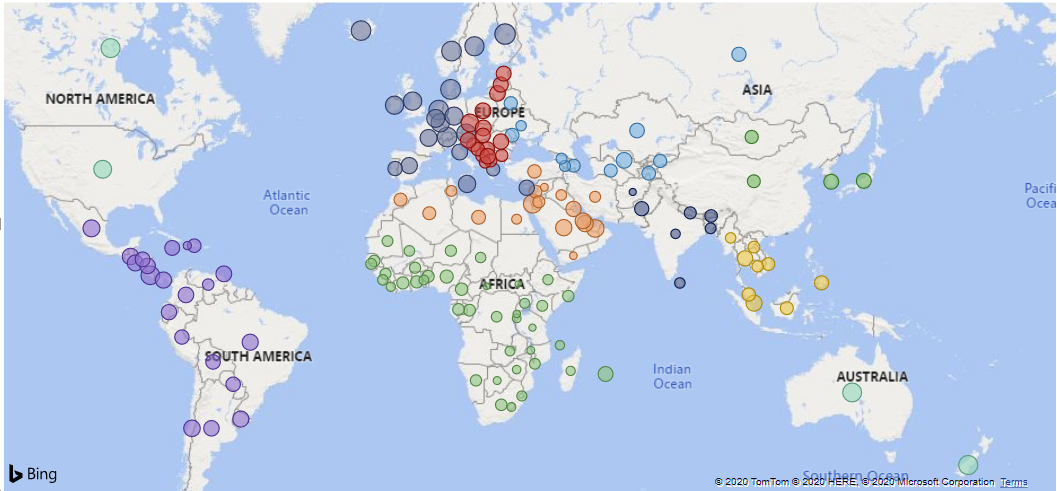
Sort elements
- Country
- Region
- Happiness Data
- Index
-
Location
-
Legend
-
Size
-
Not included:
CorrectIncorrect -
Question 2 of 14
2. Question
Recreate the visualisation below
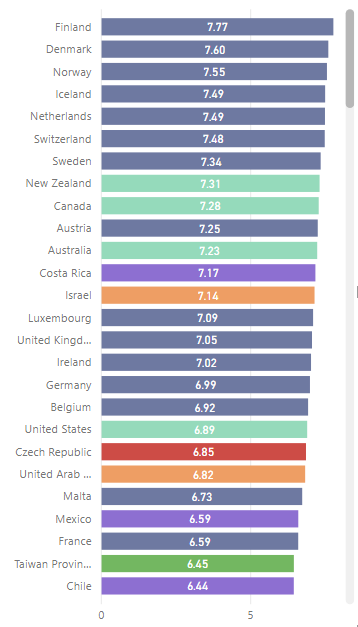
Sort elements
- Country
- Region
- Happiness Score
- Explained By: GDP per Capita
-
Axis
-
Legend
-
Values
-
Not Included
CorrectIncorrect -
Question 3 of 14
3. Question
In which factors is Japan above average?
CorrectIncorrect -
Question 4 of 14
4. Question
What is the MAX value for Healthy Life Expectancy? (2 decimal places)
CorrectIncorrect -
Question 5 of 14
5. Question
What is the average GDP per capita for the region of South Asia? (2 decimal places)
CorrectIncorrect -
Question 6 of 14
6. Question
With the regions, East Asia, South Asia and Southeast Asia selected, which country has the highest happiness score?
Copy your answer directly from the excel cell.
CorrectIncorrect -
Question 7 of 14
7. Question
Again with the regions East Asia, South Asia and Southeast Asia selected, Select the top 10 countries by happiness score. What is the average Healthy Life Expectancy for this selection? (2 decimal places)
CorrectIncorrect -
Question 8 of 14
8. Question
Which factors have the highest correlation with Happiness Score? (top 3).
CorrectIncorrect -
Question 9 of 14
9. Question
Of all the factors, which have the highest correlation to each other? (select the 2 factors)
CorrectIncorrect -
Question 10 of 14
10. Question
Which country has the highest of both GDP per capita and Healthy Life Expectancy?
CorrectIncorrect -
Question 11 of 14
11. Question
Which regions are above the 90th percentile in both Generosity and Perceptions of Corruption? (Select all that apply)
CorrectIncorrect -
Question 12 of 14
12. Question
What is the dotted line in the chart below?
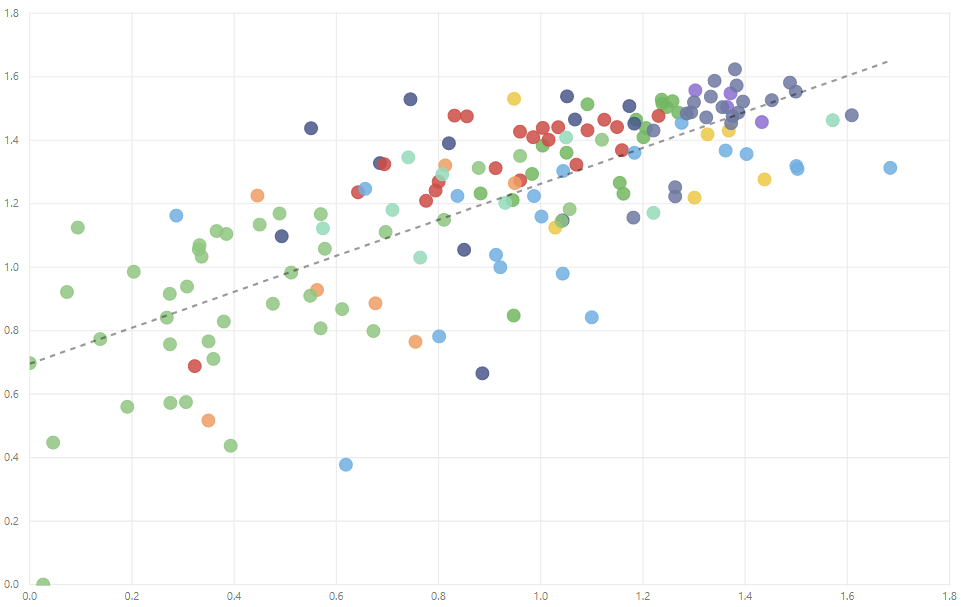 CorrectIncorrect
 -
Question 13 of 14
13. Question
Use the “Key Influencers” visualisation:
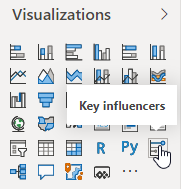
Add ‘Happiness Score’ to ‘Analyse’ and the 7 factors to ‘Explain by’.
Which of the below factors do not appear on the Key influences?
CorrectIncorrect -
Question 14 of 14
14. Question
Create a histogram of Happiness score. Change the number of bins to 10. What is the lower bound of the bin that contains the largest number of countries?
Give your answer correct to 2 decimal places.
CorrectIncorrect